


 Media kit
Until today, inspectors had no information on the beam coverage produced by multi-element ultrasonic inspection devices offering the TFM method (total focusing method). Essentially, they had to rely on their assumptions. Indeed, the inspectors had to assume that beam coverage was uniform over the entire target area. However, as we all know, assumptions are no guarantee of accurate results.
Knowing in advance the level of coverage provided by each propagation mode, and where signal sensitivity is best - and worst - gives inspectors a considerable advantage. They can be much more certain of each mode's ability to detect the type of defect they're looking for. And in the inspection business, greater certainty is a great advantage.
Acoustic region and TFM method
Although the TFM method has been used for decades in the medical industry and for some years now in the non-destructive testing industry, inspectors using this method often have to work on a trial-and-error basis to achieve the right results. The numerous propagation mode options (imaging or sound paths) can confuse the user and make inspection results unpredictable.
With a conventional TFM system, the user must assume that the region of acoustic influence (or energy) is evenly distributed over the entire target area on the inspection plane. In reality, the level of acoustic influence varies within the TFM scan area, so that some defects may not be detected, even with a sufficient signal-to-noise ratio. Many factors can have an effect on the actual acoustic influence, such as the propagation speed of the waves in the material, the probe frequency, the orientation of the defect, and so on. Most importantly, the acoustic influence is highly dependent on the inspection mode chosen.
The challenge of using the TFM method
This method of creating a working zone gives the user false expectations. As with the classic PAUT method, the beam focusing performed by the software after acquisition is limited by the physics of ultrasound. Some beams simply cannot reach all regions of the zone with the assumed focusing power.
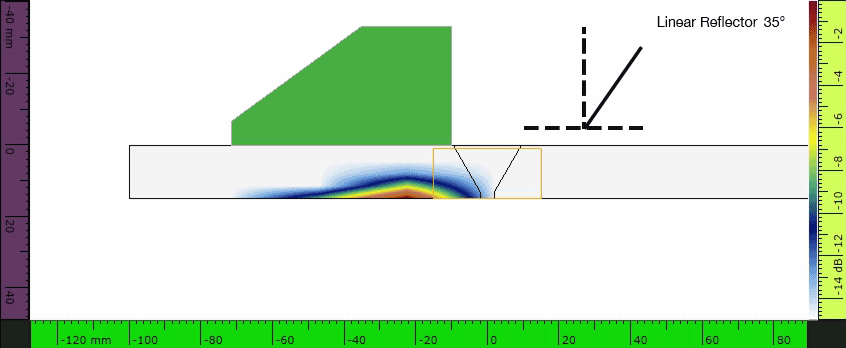
For example, in TTT mode, it is not possible to achieve a high enough acoustic sensitivity to detect a reflector located in the upper right-hand corner of the zone (see screenshot below). However, an inspector could easily assume that this section is covered and believe it to be part of the focused zone.
AIM modeling tool - The red arrow has been added to highlight the lack of amplitude response in the upper right-hand corner of the area for a TT-T propagation mode on a plane fault.
Improve your aim
The Acoustic Influence Modeling (AIM) tool guides the user in selecting the appropriate mode for a given defect type. The tool creates an amplitude model in the established zone directly in the fault finder OmniScan™. Modeling displays a color code :
- Red areas indicate very good ultrasonic response, with a deviation between 0 dB and -3 dB from maximum amplitude.
- Orange zones show a deviation of between -3 dB and -6 dB from maximum amplitude.
- For yellow zones, the difference is between -6 dB and -9 dB.
- And so on.
Inspectors can select an omnidirectional (volumetric) reflector, such as porosity, or a more planar reflector, such as a crack. When the defect type is selected, AIM modeling updates, showing the difference in amplitude for a given defect in a given mode.
Acoustic influence modeling (AIM) tool - AIM modeling changes as the reflector angle value changes.
This feature allows inspectors to compare the coverage of each mode and ensure that they achieve the optimum signal sensitivity for detection in the defined area. Before even starting inspection, inspectors can be sure they are using the right mode for the type of defect they are targeting.


